Versionen im Vergleich

Schlüssel

  • Diese Zeile wurde hinzugefügt.
  • Diese Zeile wurde entfernt.
  • Formatierung wurde geändert.
Sv translation
languagede

In diesem Beitrag stellen wir Ihnen zwei praktische Anwendungsbeispiele für Berechnungsregeln vor, die in QUDE beim Erstellen von Datenpunkten Verwendung finden.

Info
titleHilfreiche Beiträge

In den Beiträgen "Einführung in QUDE" und "Blöcke in QUDE und deren Funktionen" haben Sie bereits erfahren, wofür wir QUDE in QBRX nutzen und welche Möglichkeiten Sie haben, um das Optimum aus dem Tool rauszuholen.

Datenpunkte können entweder direkt an Facilities angelegt, oder bei Auswertungen unter "Meine Datenpunkte" erstellt werden.


1. Beispiel: Lastgang pro m²

Beim ersten Beispiel berechnen wir den Stromlastgang pro m², bezogen auf die Gesamtfläche eines Standortes.

Mit Hilfe der dadurch entstandenen Zeitreihe können Sie den Stromverbrauch verschiedener Standorte besser miteinander vergleichen. Das ist zum Beispiel beim Vergleich mehrerer Verkaufsstellen besonders praktisch und kann auch mit anderen Datenpunkten ähnlich verwendet werden.

Für die Erstellung der Berechnungsregel benötigen wir die Werte des Lastgangs, die durch den Wert der Gesamtfläche geteilt werden.


Schritt-für-Schritt Anleitung

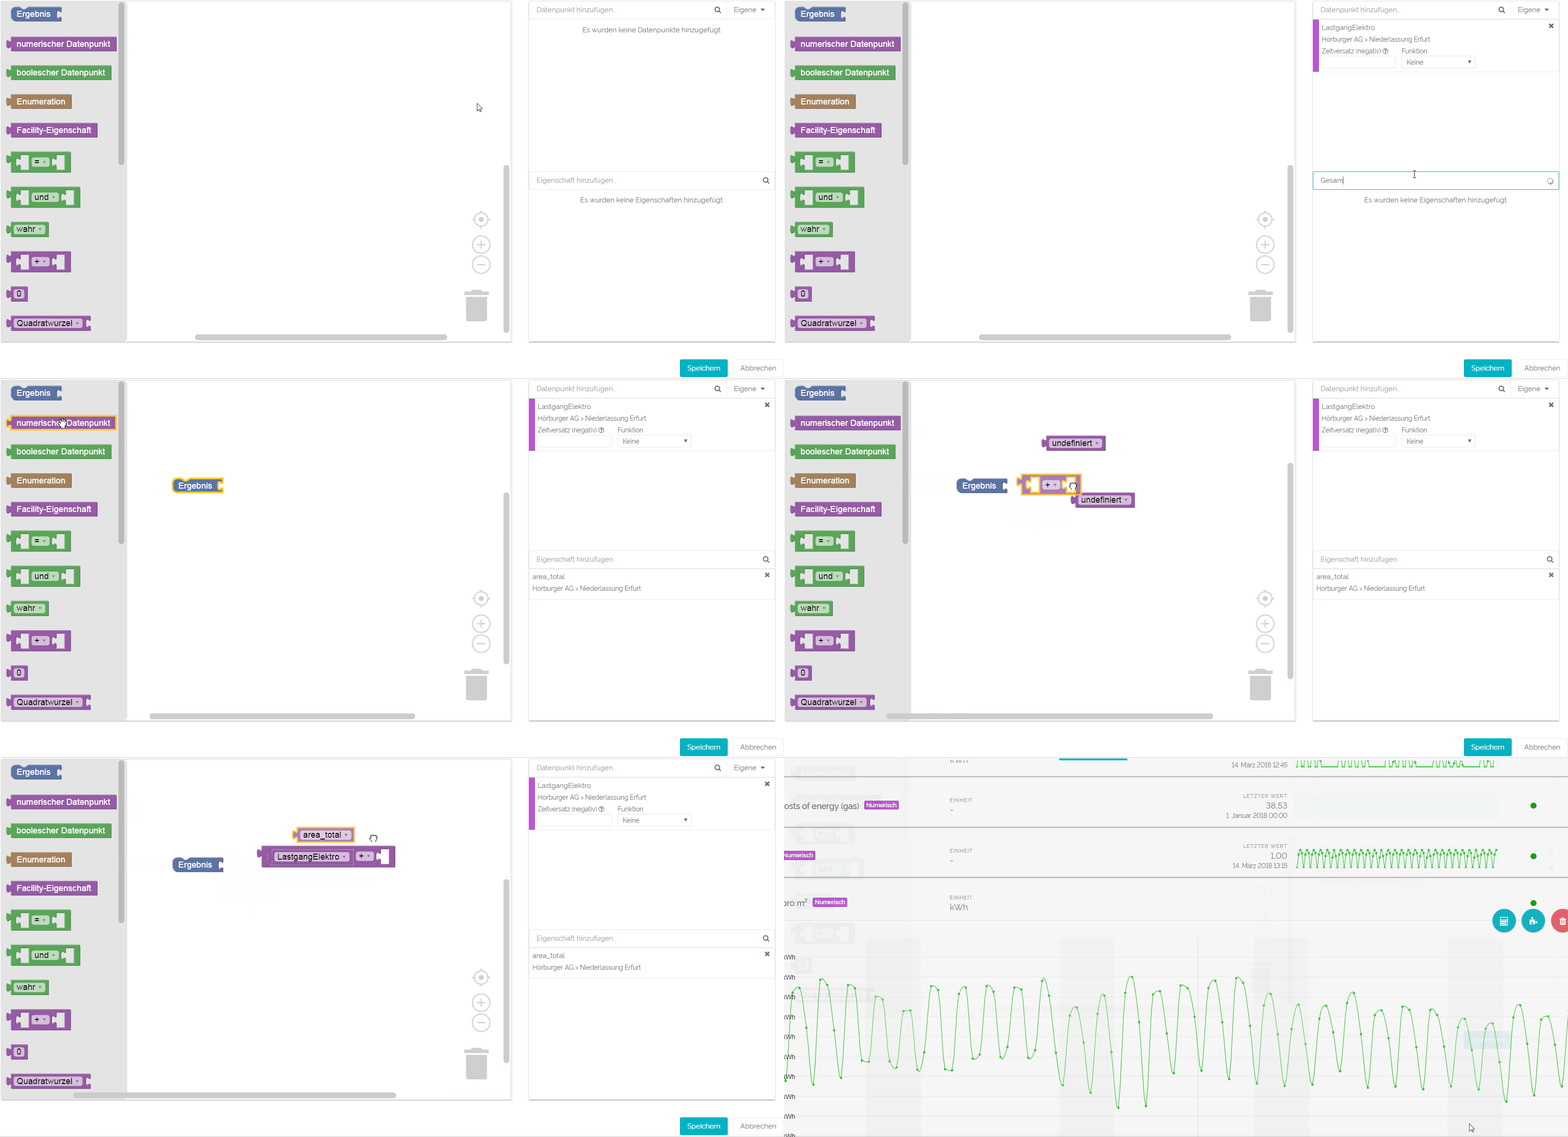
  1. Fügen Sie den Datenpunkt "Lastgang Elektro" der Liste auswählbarer Datenpunkte hinzu

    • Wählen Sie den Datenpunkt, den Sie in Ihre Auswertung einbinden möchten. 


  2. Fügen Sie die Eigenschaft "Gesamtfläche" der Liste auswählbarer Eigenschaften hinzu

    • Wählen Sie die Eigenschaft, die Sie in Ihre Auswertung einbinden möchten. 


  3. Ziehen Sie die Blöcke in die Arbeitsfläche

    • Benötigte Blöcke: Jeweils ein Block für das Ergebnis, für numerische Datenpunkte, für Facility-Eigenschaften und für Grundrechenarten


  4. Ordnen Sie Datenpunkt und Eigenschaft den passenden Blöcken zu

  5. Erstellen Sie die Berechnung, in welcher der Lastgang durch die Gesamtfläche geteilt wird

    • Der Block für Grundrechenarten wird von links nach rechts ausgelesen. 

    • Demzufolge wird der Lastgang am linken freien Bereich innerhalb des Blocks angedockt und die Gesamtfläche im rechten. 

    • Als Grundrechenart wählen Sie ÷

    • Verbinden Sie den gesamten Block mit dem Ergebnis, um QUDE mitzuteilen, dass diese Berechnung ausgewertet werden soll
        

  6. Speichern Sie Ihre Einstellungen


2. Beispiel: Dynamische Berechnung von Energiekosten

Im zweiten Beispiel erstellen wir eine dynamische Berechnung der Energiekosten, die beim Erdgasverbrauch anfallen.

Dieses Beispiel kann als Grundlage für viele Berechnungen genommen werden, in die eine Vielzahl an Faktoren einfließen. 

Es gibt zwei Besonderheiten beim Aufbau dieser Berechnungsregel: Die Nutzung von Variablen und das Ineinanderstecken mehrer Blöcke für Grundrechenarten. In dieser Regel gibt es eine Berechnung (Energiepreis + Energiesteuer) innerhalb einer anderen ((Energiepreis + Energiesteuer) x Lastgang). Die erste Teilrechnung wird quasi durchgeführt, als würde sie in einer Klammer stehen.

Um die Berechnung übersichtlicher zu gestalten, verwenden wir eine Variable, die stellvertretend für die gerade erläuterte Rechnung steht. Durch diese Vorgehensweise spart man sich eine extra Ebene innerhalb der Blöcke für Grundrechenarten und macht so die gesamte Berechnung wesentlich übersichtlicher. Diese Variable wird in der nächsten Zeile mit der Netzentgeltpauschale addiert und als Zeitreihe ausgegeben.

Ohne die Blöcke würde die Berechnung also wie folgt aussehen:

Ergebnis = ((Energiepreis + Energiesteuer) x Lastgang) + Netzentgeltpauschale


Schritt-für-Schritt Anleitung

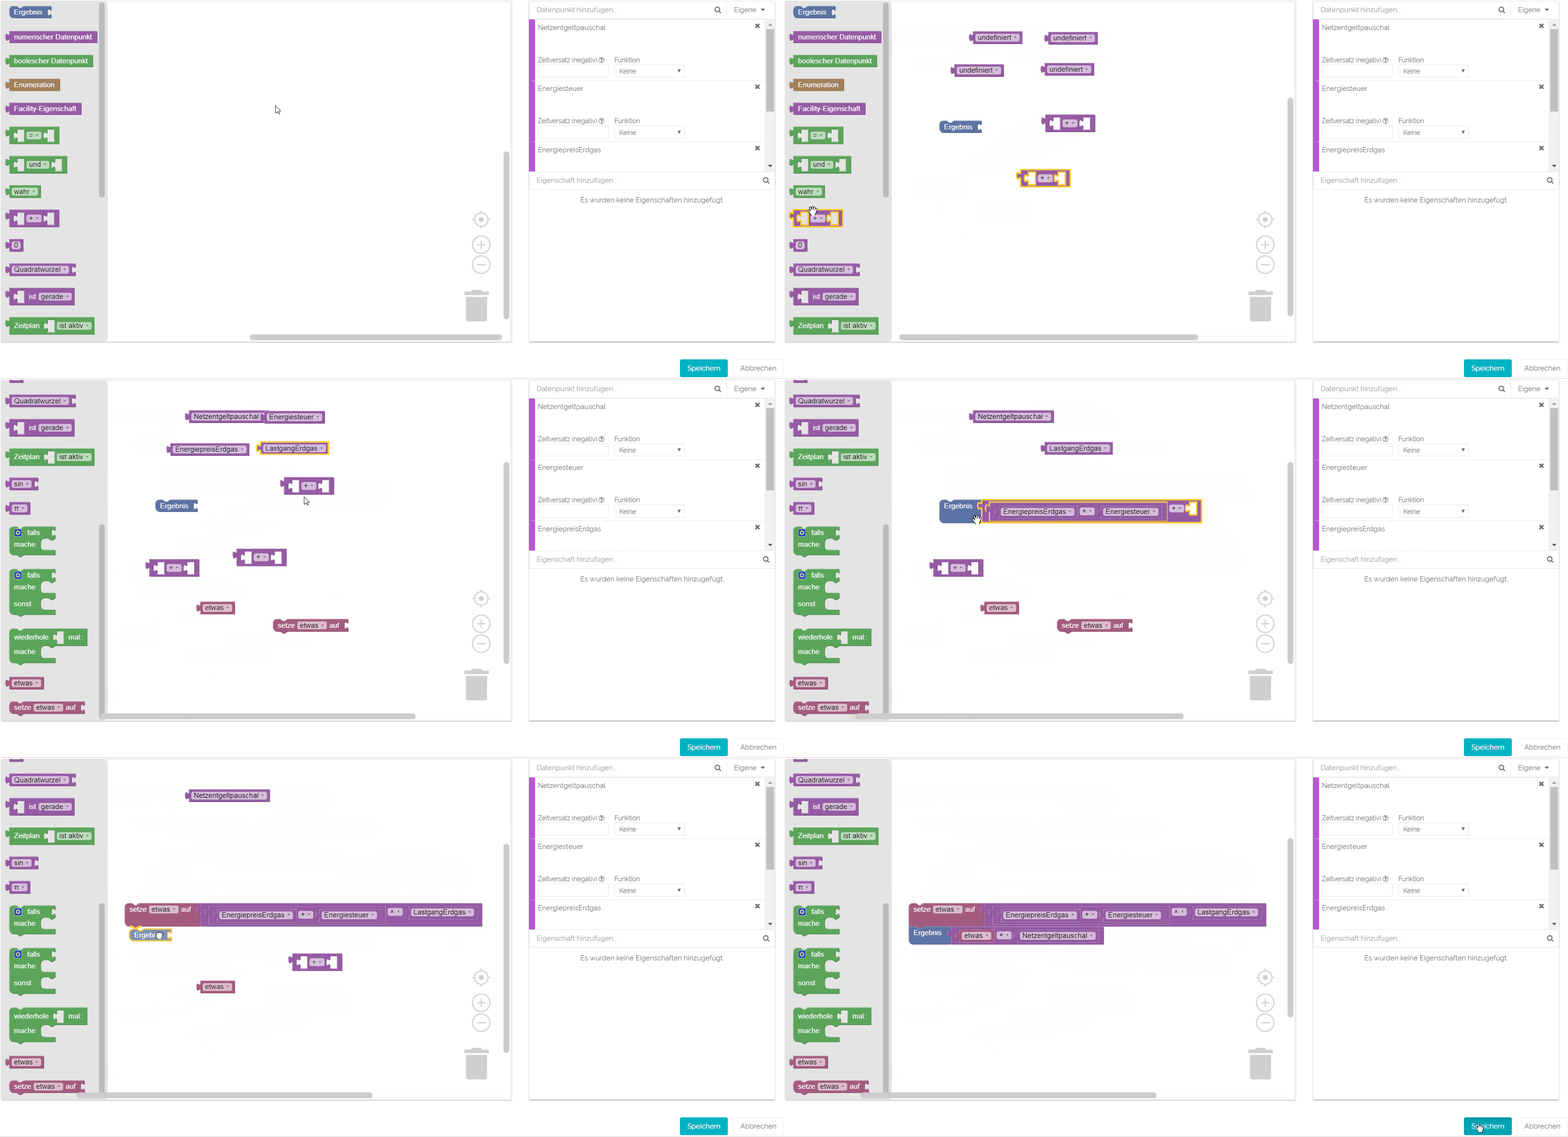
  1. Fügen Sie alle benötigten Datenpunkte der Liste auswählbarer Datenpunkte hinzu

    • Wählen Sie die Datenpunkte, die Sie in Ihre Auswertung einbinden möchten.

    • In diesem Beispiel benötigen wir: den Energiepreis von Erdgas, die passende Energiesteuer, den Erdgas Lastgang und die anfallende Netzentgeltpauschale 


  2. Ziehen Sie alle Blöcke in die Arbeitsfläche

    • Benötigte Blöcke: Ein Block für Variablen sowie einer zum definieren von Variablen, ein Ergebnis-Block, vier Blöcke für numerische Datenpunkte und drei Blöcke für Grundrechenarten


  3. Odnen Sie die Datenpunkte den Blöcken für numerische Datenpunkte zu


  4. Erstellen Sie den ersten Teil der Berechnung, der als Variable zusammengefasst wird

    • Setzen Sie in einen Block für Grundrechenarten mit einem + die ersten zwei Datenpunkte ein: Energiepreis und Energiesteuer. Das ist die erste Teilberechnung.

    • Setzen Sie die gesamte erste Teilberechnung in einen zweiten Block für Grundrechenarten ein. In den anderen freien Bereich kommt der Datenpunkt für den Lastgang. Als Rechenzeichen wählen Sie x. Jetzt wird die erste Teilberechnung so mit dem Lastgang multipliziert, als stünde Sie in Klammern.
    • Diese gesamte Berechnung der drei Datenpunkt kombinieren Sie nun mit dem Block zum definieren für Variablen. Optional kann ein Name für die Variable gewählt werden. Der Variablenblock kann nun stellvertretend innerhalb der aktuellen Arbeitsfläche für die gerade erstellte Berechnung verwendet werden. Heften Sie die gesamte Kombination oben an den Ergebnisblock an.
       
  5. Kombinieren Sie den zweiten Teil der Berechnung, der zum Ergebnis führt und als Zeitreihe ausgewertet wird
    • Setzen Sie den Block für Variablen stellvertretend für den ersten Teil der Berechnung in den letzten Block für Grundrechenarten ein. In den anderen freien Bereichen kommt der Datenpunkt für die Netzentgeltpauschale. Als Rechenzeichen wählen Sie ein +. Dies ist nun Ihre gesamte Berechnung, nur verkürzt durch die Variable.
    • Heften Sie diese Berechnung rechts an den Ergebnisblock an. QUDE führt nun die gesamte Berechnung aus und erstellt daraus eine Zeitreihe.
       
  6. Speichern Sie Ihre Einstellungen 


Sv translation
languageen

In this article we'll present you some practical examples of evaluation rules for data points that can be created in QUDE.

Info
titleHelpful articles

Take a look at our articles "Introduction to QUDE" and "Blöcke in QUDE und deren FunktionenFunktionen" if you would like to know more about the tool itself. 

Data points can be created at facilities or as an analysis in "my data points".


1st example: load profile per m²

For the first example, we'll be calculation the electricity load profile per m², in relation to the total area of a facility. 

You could use the newly created time series to compare the electricity consumption of various sites with each other in a practical way, for example to compare different shops. Plus, this structure also works with a variation of data points.

For this evaluation rule, we'll need the values of a load profile that are divided by the total area of a matching facility. 


Step-by-step instruction

  1. Add the data point "load profile electricity" to your list of usable data points

    • Select the data point you would like to use for your evaluation.


  2. Add the facility property "total area" to your list of usable properties

    • Select the data point you would like to use for your evaluation.


  3. Drag and drop all necessary bricks into the work surface and combine them

    • Used bricks: One result brick, one brick for properties, one for numeric data points and one brick for basic calculation operations


  4. Assign the data point and property to the matching bricks


  5. Combine the bricks to form an evaluation rule 

    • The brick for basic calculation operations is read from left to right.

    • Therefore, the load profile is linked to the left open space and the total area to the right one.

    • Choose ÷ as the calculation operation.

    • Combine the whole calculation with the result brick to tell QUDE, that all of this should be evaluated.


  6. Save your settings

2nd example: Highlighting peak loads 

Image Removed

For the

2nd example

we'll create a data point that calculates the active operating hours of a system in a time series.

The data point can, for example, be further evaluated in a table. Like this, you could add up the real operating hours and compare them to the originally estimated hours to find discrepancies and take care of possible problems. However, the data point can be used for more than this evaluation.

The base for this numeric data point is a boolean data point. The boolean data point has two outcomes

:

True (as "1") if the system is active or false (as "0") if it's inactive. We need those values but as a time series to analyse them in a table. That's why we're telling QUDE, with the help of a conditional brick with further outcome, to calculate the value "1" whenever the system is active and "0" whenever it's inactive. Those values can be used in further evaluations to add up the active operating hours. 

Step-by-step instruction 

Add the data point "activity status" to the list of usable data points

Add the opening hours of the facility you would like to integrate into your evaluation.

  • Drag and drop all necessary bricks into the work surface and combine them

    • Used bricks: One conditional with further outcome, one boolean data point, one relational operator, two results and three constants


  • Choose the data point in the matching brick


  • Choose the condition at "if": 

    •  Put the boolean data point in the left space of the relation operator brick and a "1" constant in the left space. Choose = as the relation operator. Now link this combination to the "if" line of the condition brick.

    • Whenever the boolean data point equals 1 (meaning "true", the system is active), a defined consequence at "do" will be calculated, or "else" if that's not the case.
       
  • Define the first outcome at "do"
    • Link a result brick and the constant "1" to "do" at the condition brick.
    • You have now defined, what should be calculated, if the condition at "if" takes place. In this case, the value "1" is calculated in the time series.
       
  • Define the second outcome at "else"
    • Link a result brick and the constant "0" to "else" at the condition brick.
    •  You have now defined, what should be calculated, if the condition at "if" does not takes place. In this case, the value "0" is calculated in the time series.
       
  • Save your settings


  • Image Removed

    3rd example:

    dynamic evaluation of energy costs

    For the third second example, we create a dynamic evaluation of energy costs that result from the consumption of natural gas. This example can be used as a template for many evaluations.

    This evaluation rule has two special features: The usage of variables and the assembling of more than one brick for basic calculation operations. 

    In this evaluation, there is one evaluation (energy price + energy tax) inside another one ((energy price + energy tax) x load profile). The first evaluation is calculated as if it would be in parantheses.

    We then use a variable representatively for the calculation we just explained. This approach saves time and space, because you don't need another level inside a brick for basic calculation operations. Instead, we use the variable in the next line and add the grid fee flat to evaluate a time series. 

    Withour the bricks, the calculation would look like this:

    Result = ((ernegy price + ernegy tax) x load profile) + grid fee flat


    Step-by-step instruction

    1. Add all necessary data points to your list of usable data points

      • Select the data points you would like to use for your evaluation. 

      • For this example, we'll need: the enery price, energy tax, load profile electricity and gird fee flat


    2. Drag and drop all necessary bricks into the work surface and combine them

      • Used bricks: One result brick, one brick for properties, one for numeric data points and one brick for basic calculation operations


    3. Assign the data points to the bricks for numeric data points


    4. Create the first part of the evaluation, that will later be presented by the variable

      • Put the two data points for energy price and energy tax in a brick for calculation operators wih a +. This is the first sub-calculation.

      • Put this sub-calculation in another brick for calculation operations. Assign the load profile to the remaining space. Set the operator to x. Now, the first sub-calculation is multiplied with the load profile as if it would be in parantheses. 

      • Link the whole calculation up until now to the brick that defines a variable. You can choose a name for the variable, if you like to. The brick for variables can now representatively be used in place for this calculation. Link the whole combination to the top of the result brick.


    5. Combine the secound sub-calculation that will end in the final result and a time series

      •  Link the variable brick representatively for the first calculation to the last brick for calculation operations. The last gid fee flat is connected to the remaining free space in this brick and the operation is set to +. This almost is your whole calculation, shortened by the variable.

      • Link this part of the calculation to the right side of the result brick. QUDE will now calculate a time series.
         

    6. Save your settings