Versionen im Vergleich

Schlüssel

  • Diese Zeile wurde hinzugefügt.
  • Diese Zeile wurde entfernt.
  • Formatierung wurde geändert.

...

Sv translation
languageen

In this article, we talk about the export of values of one or multiple data points als a CSV file. 


Inhalt


1. How and where can I export data point values?


Data points can be exported as Benchmarks in the Analysis area.

Follow these steps to export your data:

  1. Click on the "plus-"button to add a new Benchmark or choose an existing one
     
  2. Configure the benchmark
    • Add data point
    • Configure data points
    • Select a time period
       
  3. Press the "Export"-button 
     
  4. Configure the CSV file
     
  5. Click on "Download"


Image Added

2. Exportable types of data points


Only numeric data points can be exported in benchmarks.


3. Possibilities for configurations 


There are multiple ways to choose and adjust the data points you would like to export.
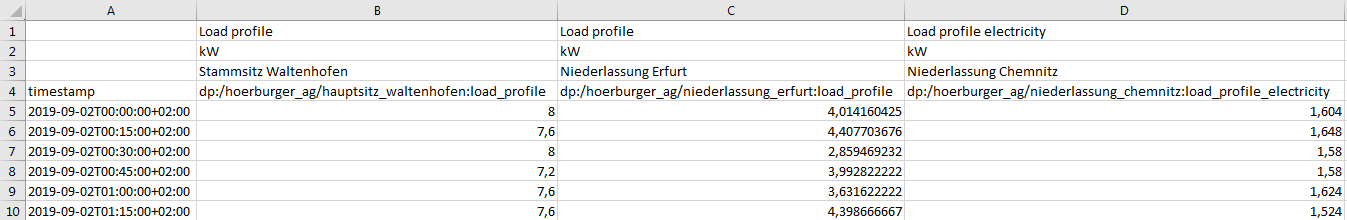
ConfigurationDescription
Time range

Global time filter

  • By default, data is exported for the time range set in the global time filter
  • The global time filter can be found at the top of the screen, next to the QBRX logo

Fixed benchmark time range

  • You can also set a fixed time range in the benchmark
  • The benchmark data and the data of the exported CSV-file are aggregated for this time range
  1. Click on the "Change time range" button
  2. Select "Use custom time range"
  3. Choose time range
  4. The chosen time range is shown below the name of the benchmark
  5. The fixed time range stays the same, even after changing the global time range
Aggregation levelDetermine the level of aggregation for your data. The aggregation is applied to all chosen data points.
Data point selection

Choose the data points for your benchmark.

You can add as many data points as you like. However, please note that you can only choose numeric data points of your currently selected account.

How to restrict the data point search

  • You can search or the name of the data point and its facility at the same time
  • Use the global filter to restrict your search results
Calculation
type
methodThis feature indicates, how the values are calculated. This can be changed for every data point separately.


Image Added

4. Formatting of the exported CSV file 


There are multiple options for the configuration of the exported CSV file in order to enable further processing. Depending on your choices, more or less data will be in the CSV file or it is displayed in different way. The exported file can then be opened and edited in Excel or other programs.


ConfigurationDescription

Included fields

Facility name

Data point name

Unit

Select one of these options to include the information in the CSV file.

Attention: You selection is not saved and has to be made again for each export.

Decimal separatorChoose the punctuation to separate decimal digits.
Time stamp

Default time stamp: dd.hh.yyyy hh:mm:ss

Time stamp ISO 8601: yyyy-mm-ddThh:mm:ss+01:00


Example

Image Added   Image Added


5. Example: Export of load profiles of multiple sites


To compare load profiles of different sites with each other and further process them, they can easily be exported. 

In this example, we want to export a CSV file with values every 15 minutes of the last 30 days. 

  1. Create new benchmark
     
  2. Add the data point "Load profile" of multiple sites
     
  3. Set aggregation to "15 minutes"
     
  4. Set global time filter
    • You can also use the fixed time filter of the benchmark
       
  5. Click on buttom "Download data point values as CSV file"
     
  6. Select the information that should be included in the file
     
  7. Choose dezimal separator
     
  8. Choose time stamp
     
  9. Click on "Download" to export your data

Image Added