...
| Sv translation | ||
|---|---|---|
| ||
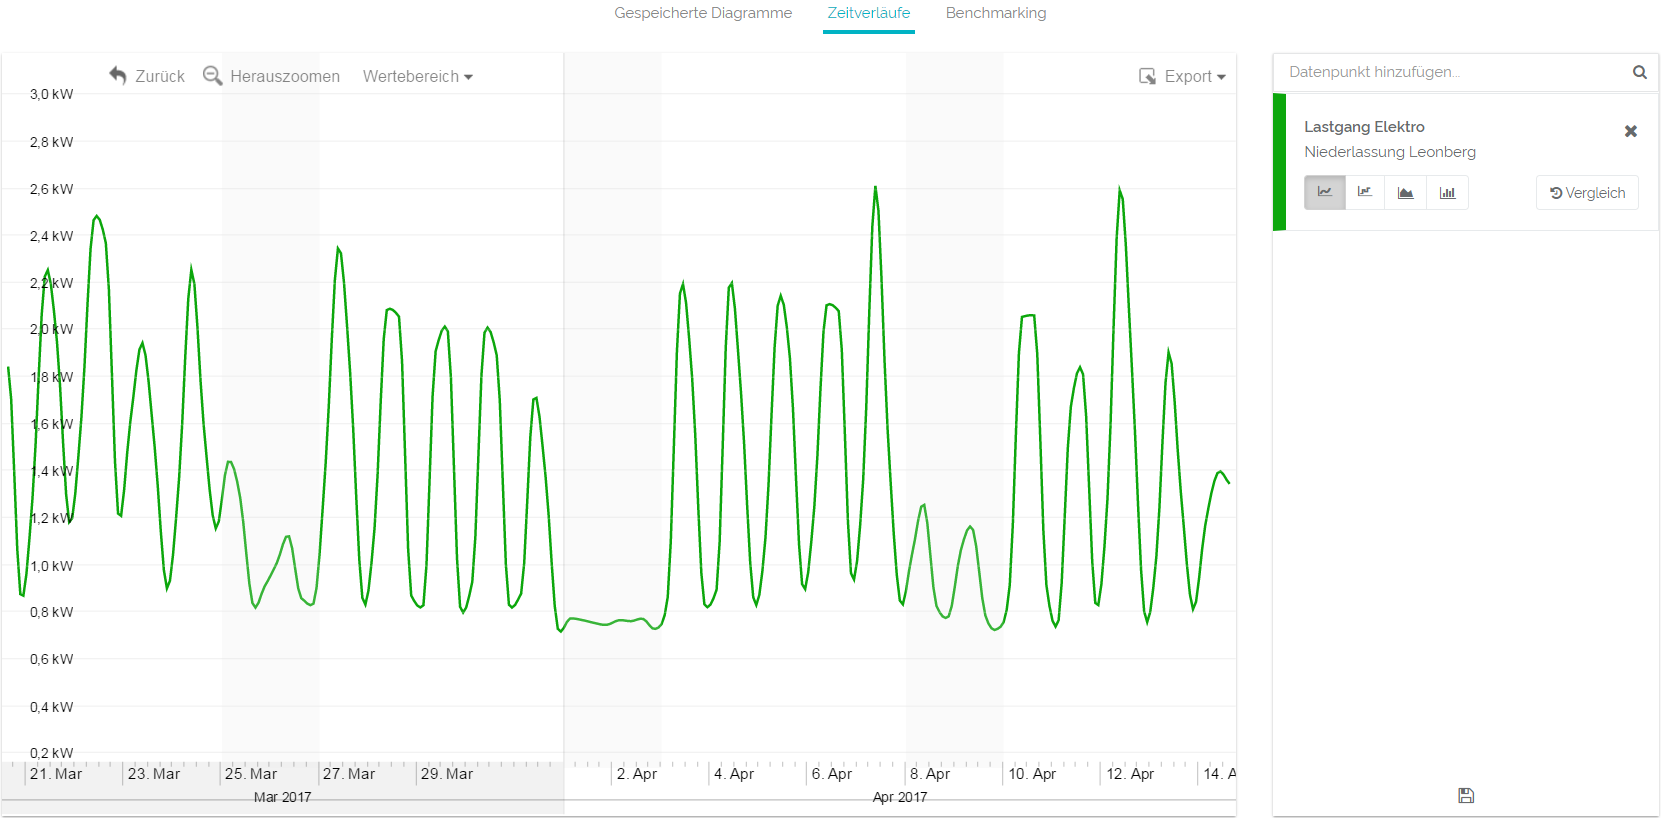
When managing your energy balance, your are more than once confronted with the terms "load profile" ad "energy distribution". However, it's not always clear when to use one or the other. That's why we prepared a short explanation for you, that summarizes the most important points. Load profile: In general, the load profile shows data that is measured every 15 minutes (or every hour for natural gas). The data will be shown in kW (kilowatt), but is actually kW/1/4h (kilowatt per quarter hour). Your meters send information of their consumption to QBRX every 15 minutes. Those are current values. In a load profile chart the graph is geared to these values.
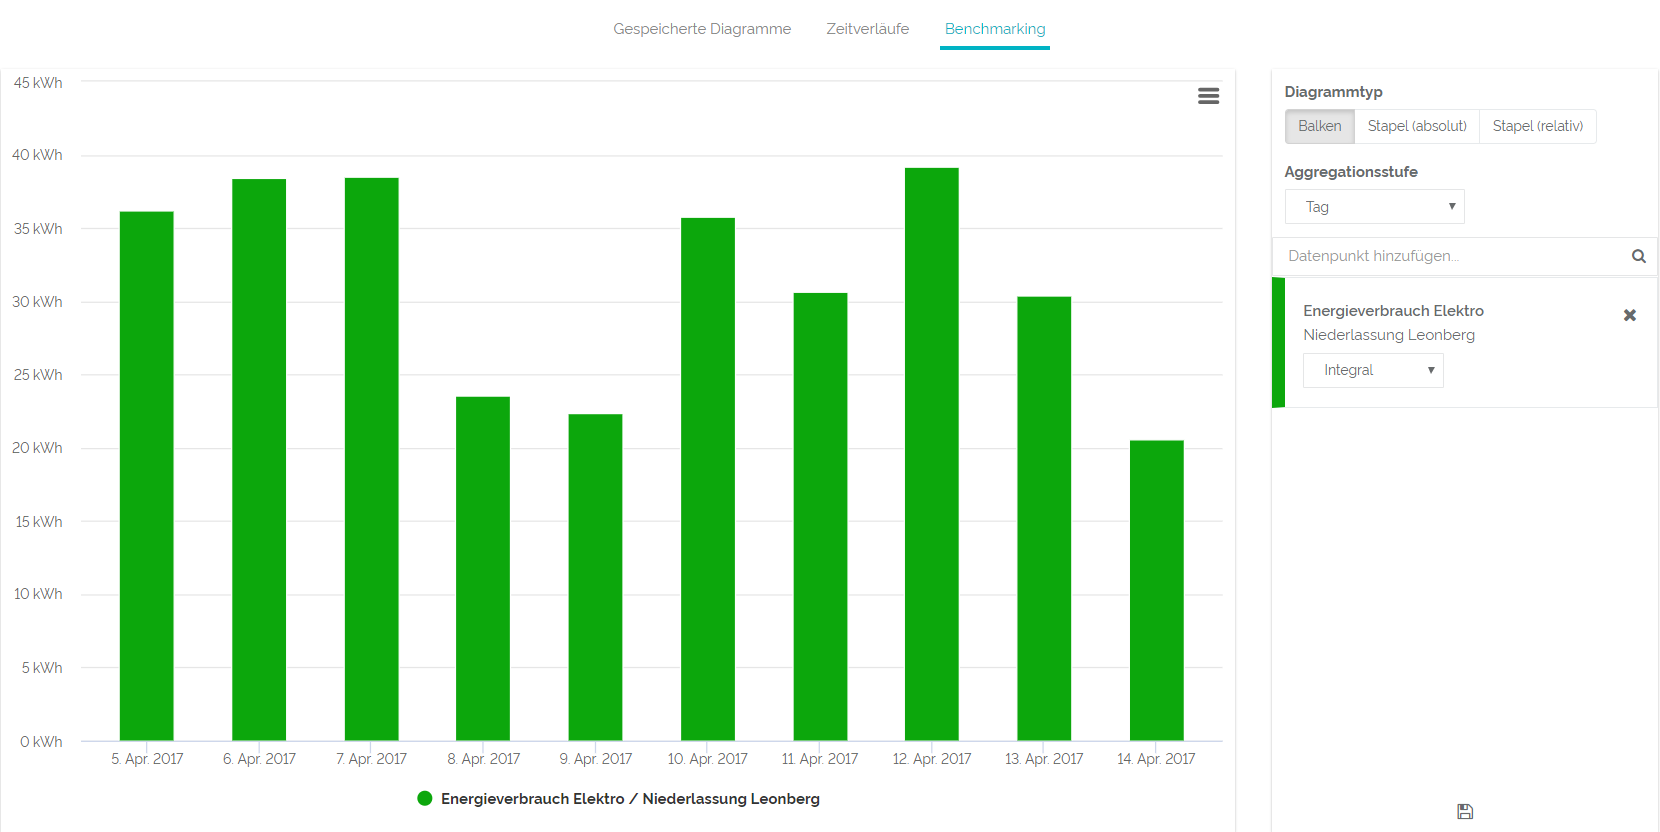
A short calculation example: There are four measurements from 7 a.m. to 8 a.m.: 10 kW/20 kW/ 50 kW/ 80 kW There are also four measurements from 8 a.m. to 9 a.m.: 80 kW/ 60 kW/ 100 kW/ 80 kW The load profile of these two hours is geared to these four values. Therefore, it would rise during the first hour and alternate during the second hour. This way you can see the data of each specific moment and recognize peaks more easily. Energy consumptionEnergy consumption is not displayed in kW (kilowatt), but in kW/h (kilowatt per hour). However, it will mostly be presented as kWh. It presents the four activity values measured within one hour, that are the source for the average value of one hour. To get the energy consumption of one day or week, QBRX simple adds up these activity values.
A short calculation example: We already know the load profile values from 7 a.m. to 9 a.m.. To get the energy consumption, we convert these values to kWh. To do this, we need the average value of the four measurements. In practice it could look just like this: 7 a.m. to 8 a.m.: 10 kW + 20 kW + 50 kW + 80 kW = 160 kW 160 kW : 4 = 40 kWh The energy consumption amounts to 40 kWh. While the load profile graph was rising, the average value is the same for one hour and therefore constant. The following hour looks exactly the same: 80 kW + 60 kW + 100 kW + 80 kW = 320 kW 320 kW : 4 = 80 kWh Instead of an alternating graph you get a stable value, that shows the energy consumption of one hour. The energy consumption from 7 a.m. to 9 a.m. would be 120 kWh. |