This article deals with the following topics: - What are data point strategies?
- A list of all strategies
- Example: calculating the summ of child facilities
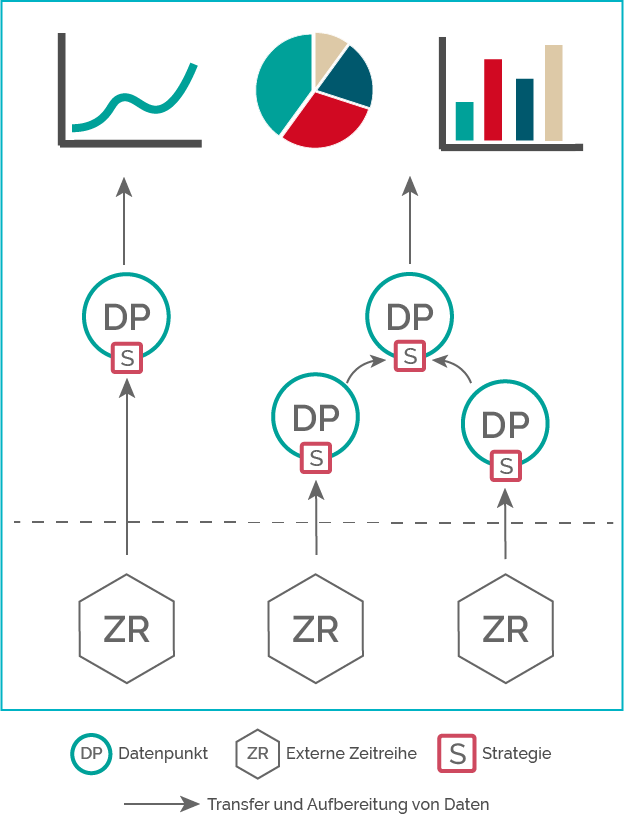
1. What are data point strategies?Every facility data point has a strategy that collects data from various external and internal sources to process them. A data point receives its data either from external time series, another data point or more than one data point, depending on the strategy. ThereforTherefore, a facility data point always needs a strategy to find data and process it according to its specific requirements. 
2. A list of all strategiesVarious strategies are available for you in QBRX. They are all grouped up by their respective source time series. The first two columns of the table, you can see the source and its matching strategies. The following columns deal with show the possible configurations of the targeted time series. The Description gives description provides additional information about the strategy. | Source | StartegyStrategy | Numeric | Boolean | Enum | Not Non-periodic | Periodic | No Interpolation | Linear interpolated | Keep-lastLast-Value | Description |
|---|
| External time series | Without calculation |  Image Added Image Added
| | | | | Image Modified | | | External data is converted to internal data and will be normalized and interpolated depending on the targeted time series. Example: meter readings, temperatures, switching states |
|---|
| Accumulation | |
|
|
| |
| | | An accumulation adds up all values of one time series. The interpolation can be adjusted. Example:Adding up single quantities of a production | | Accumulation with zero values | Image Added |
|
|
| Image Added |
| Image Added | Image Added | An accumulation adds up all values of one time series. With this strategy, a zero value is generated if the data input is missing. Example: Correction of controllers that only send data if energy consumption has been measured | | Derivation | Image Added |
|
| | |
|
| | The derivation calculates the course growth of a source time series. DerivatedDepending on the chosen meaning, derivated, external data will be normalized periodic or non-periodic and interpolated according to Keep-lastLast-Value. Example: calculation of the load profile from active energy | Reference
| Without calculation | Image Added | | | | | Image Modified | | | Data is copied from one data point to another and interpolated depending on the targeted time series. Example: using the same value at different facilities (e.g. the outdoor temperature of a site for all corresponding buildings) |
|---|
| Basic calculation | Image Added |
|
| | Image Added |
| Image Added | Image Added | In this calculation, the result gets calculated out of two numeric operands using a simple mathematical operation (+ - × ÷). The operands can be data points, facility properties, or constants. Example: Calculation of the energy consumption per area of a site (energy ÷ area) | Derivation | Image Added |
|
| | |
|
| | The derivation calculates the course growth of a linear interpolated source time series. Derivated Depending on the chosen meaning, derivated data will be normalized periodic or non-periodic and interpolated according to Keep-lastLast-Value. Example: calculation of the load profile from active energy | | Derivation (Only only positive values) | Image Added |
|
| | |
|
| | The derivation calculates the course growth of a linear interpolated source time series. Derivated Depending on the chosen meaning, derivated data will be normalized periodic or non-periodic and interpolated according to Keep-lastLast-Value. Negative values, that stem from a descending course of the source time series, are filtered out. This avoids distortions of results that could, for example, occur by meter exchanges. Example: calculation of the load profile from meter readings. that can be resetted | | Integration | |
|
|
| |
| |
| The integral calculates the area beneath a graph. In this case, data of a referenced Keep-Last-Value data points are integrated and and result in a linear interpolated time series. Example: calculation of active energy from the load profile | CustomQUDE calculation
| | | | | |
| | | Custom calculations can be created in QUDE with respective source time series. Those source time series stem from internal data points and properties. Interpolated values of time series are used for the calculation of non-periodic data points. The final interpolation and period of the calculated data point depend on the chosen meaning. More information about QUDE can be found here. | | Child facilities | Average | |
|
|  Image Added Image Added
| |
| | | With the help of this strategy, the data point receives values from ata points of subordinate facilities with the same meaning. The interpolation depends on the meaning and therefore stays the same. The average and sum are calculated with these values. In contrast to other strategies, sources are determined automatically and don't have to be chosen. Newly added, matching data points will be included immediately. Image Added Attention: The calculation of child-facilities can also be used for non-periodic meanings, but only if their time series is interpolated according to Keep-Last-Value! Example: evaluating all load profiles of a site |
|---|
| Sum | |
|
| Image Added | |
| | | | Minimum | |
|
| Image Added | |
| | | | Maximum | Image Added |
|
| Image Added | Image Added |
| Image Added | Image Added | | Cluster aggregation | Cluster aggregation | Image Modified |
| | Image Added | Image Modified |
| Image Modified | Image Modified | This calculation strategy aggregates data points from similar facilities. It is only available at special cluster facilities. Based on a cluster facility, all child and sibling facilities of a certain facility type with a certain property belong to a Cluster. The description of the cluster (type, property and property value) is stored in the cluster facility. Image Added Attention: The calculation can also be used for non-periodic meanings, but only if their time series is interpolated according to Keep-Last-Value! Example: Average consumption of shops with similar structural conditions |
|---|
| Own facility | Own facility | Image Modified | Image Modified | Image Modified | Image Modified | Image Modified |
| Image Modified | Image Modified | This strategy was designed for special use cases. The values come from the facility itself. Their source depends on the respective case. Example: site facilities get outdoor temperature values from a meteorological service that uses the geo-coordinates |
|---|
| Manual entry | Without calculationManual entry | Image Added | | | | | Image Modified | | | Data points with this strategy make it possible to enter values manually at the facility. The added data will be saved at an external time series and can be interpolated and normalized depending on the meaning. Example: manual meters |
|---|
| Accumulation | Image Added |
|
|
| Image Added |
| Image Added | Image Added | An accumulation adds up all manually added values. Example:Adding up single quantities of a production | | Derivation | Image Added |
|
| Image Added | Image Added |
| Image Added | Image Added | The derivation calculates the course growth of manuall added values. Depending on the chosen meaning, derivated, external data will be periodic or non-periodic and interpolated according to Keep-Last-Value. Example: calculation of the load profile from active energy |
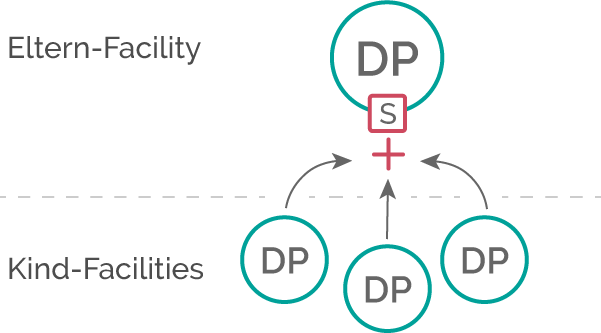
3. Example: calculating the sum of child facilitiesThe strategy "Sum of child facilities" gives the data point two kinds of information: - He'll get his data from all data points of child facilities with the same meaning, that are one layer beneath itself
- and this will be processed depending on the source data.
Like this, a load profile data point would collect all load profiles from subordinate facilities and add them up. 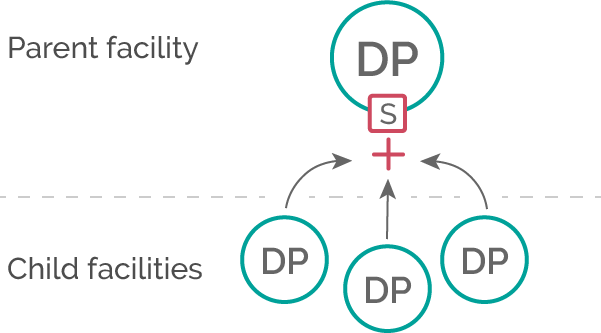
|